TL;DR:
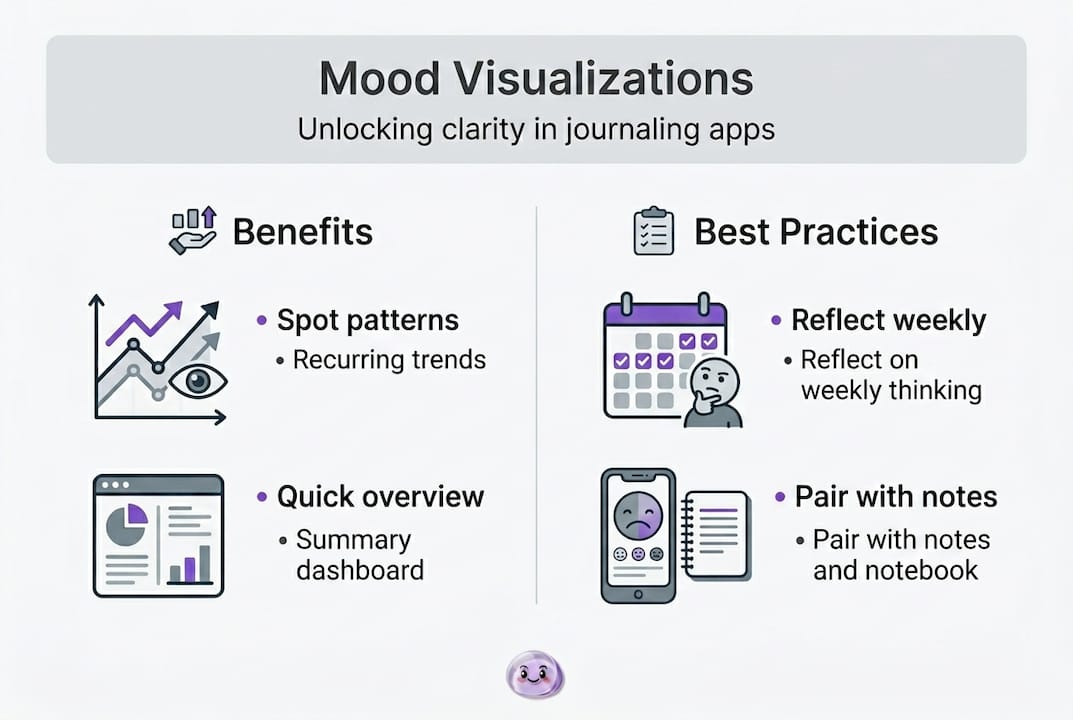
- Mood visualizations turn emotional data into charts and color maps for quick pattern recognition.
- They enhance self-awareness by revealing recurring mood patterns over time.
- Pairing visual insights with reflection and coping strategies promotes lasting emotional growth.
Most people assume that if you write enough, you'll eventually understand your emotions. But writing is linear, and feelings rarely are. Mood visualizations in journaling apps change that equation entirely, turning abstract emotional data into charts, color maps, and visual trends that your brain can actually process at a glance. Mood visualizations externalize emotions into formats that make patterns easier to identify than text alone. This guide walks you through what these tools are, how they work, who benefits most, and how to pair them with reflection for real, lasting emotional growth.
Table of Contents
- What are mood visualizations in journaling apps?
- How mood visualizations boost self-awareness and emotional well-being
- Who benefits most—and important nuances
- Pairing mood visuals with reflection for real-life change
- A fresh perspective: Why mood visualizations aren't enough on their own
- Explore mood visualizations with Voisley
- Frequently asked questions
Key Takeaways
| Point | Details |
|---|---|
| Clearer emotional patterns | Mood visualizations help you spot trends that text-based journaling often misses. |
| Greater self-awareness | Seeing emotions visually increases your self-understanding and supports mental clarity. |
| Best results when paired | Combining visuals with reflection and coping strategies leads to real-life emotional growth. |
| Not a stand-alone cure | Mood visuals are powerful tools but should not be viewed as therapy replacements. |
What are mood visualizations in journaling apps?
To see why these tools matter, first understand what mood visualizations actually are.
A mood visualization is any graphic representation of your emotional data over time. Instead of rereading pages of journal entries to find patterns, you see them instantly in a chart or color grid. That shift from reading to seeing is more powerful than it sounds. Your brain processes visual information roughly 60,000 times faster than text, which means patterns that would take weeks to notice in a diary can surface in seconds on a dashboard.
Common visual formats you'll encounter in journaling apps include:
- Mood charts and line graphs: Show emotional highs and lows across days, weeks, or months
- Calendar heat maps: Use color intensity to mark mood intensity on each day (think "Year in Pixels" style grids)
- Avatar systems: Assign animated or illustrated characters to represent your current emotional state
- Trend overlays: Layer mood data against activities, sleep, or habits to reveal correlations
- Emotion wheels: Interactive circles that let you pinpoint nuanced feelings beyond just "happy" or "sad"
These formats differ from traditional text journaling in one key way: they give you distance. When you read your own words, you re-experience the emotion. When you look at a graph, you observe it. That observational gap is where insight lives.
Here's a quick comparison of the two approaches:
| Feature | Text-only journaling | Mood visualization journaling |
|---|---|---|
| Pattern recognition | Slow, requires re-reading | Instant, visual |
| Emotional distance | Low (re-experiencing) | High (observing) |
| Data over time | Hard to aggregate | Automatic trend lines |
| Accessibility | High for verbal thinkers | High for visual learners |
| Depth of reflection | Rich, nuanced | Broad, pattern-focused |
Web-based mood tracking has made these tools available without any app download, though popular mood visualization apps like Daylio have popularized the habit-log format that pairs mood ratings with activity tags. The best approach uses both: visuals to spot the pattern, text to understand the story behind it.
How mood visualizations boost self-awareness and emotional well-being
Once you know what mood visualizations look like, it's important to understand how they actually work to improve your emotional insight.
Visual representations increase self-awareness by 37% compared to text-based journals, per Stanford research. That number surprises most people, but it makes sense when you consider how self-awareness actually works. It's not about having more words for your feelings. It's about recognizing recurring patterns without your own narrative bias getting in the way.
Here's where mood visualizations do something text simply cannot. When you log your mood as a 3 out of 10 on a Wednesday, that single data point feels insignificant. But when you see six consecutive Wednesdays colored gray on a heat map, the pattern becomes impossible to ignore. You stop asking "why do I feel bad today?" and start asking "what happens every Wednesday?"
This shift from event-level thinking to pattern-level thinking is a core benefit. Consider how different visual formats serve different needs:
| Visual format | Primary benefit | Best for |
|---|---|---|
| Line graph | Tracks emotional arc over weeks | Identifying triggers |
| Heat map calendar | Reveals day-of-week patterns | Spotting cyclical moods |
| Avatar system | Reduces verbal barriers | Teens, neurodivergent users |
| Emotion wheel | Expands emotional vocabulary | Granular self-awareness |
"The most meaningful emotional insights come not from logging a feeling, but from noticing the shape of your feelings across time."
When you unlock emotional patterns through regular visualization, you also develop stronger emotional regulation skills. You learn what conditions support your well-being and which ones drain it. This is practical emotional health practice in action, not abstract self-help advice.
Pro Tip: Don't just look at your mood chart and move on. After reviewing your visual trends, write two or three sentences about what you notice. That combination of visual recognition and written reflection accelerates your self-awareness faster than either tool alone.
Who benefits most—and important nuances
The benefits are significant, but mood visualizations aren't a one-size-fits-all solution.
Teens and neurodivergent users benefit significantly from non-verbal visual formats, since expressing emotion through words can be a barrier for many people in these groups. But the same tools can cause temporary distress when they make low mood patterns highly visible. That nuance matters.
Those who gain the most from mood visualization tools typically share a few traits:
- Visual learners who process information more effectively through images than text
- Teens and young adults who may lack the emotional vocabulary to articulate complex feelings in writing
- Neurodivergent individuals (including those with ADHD or autism spectrum differences) who find non-verbal expression more natural
- People recovering from burnout or depression who want objective data rather than emotionally charged narratives
- Habit-focused journalers who already track sleep, exercise, or nutrition and want emotional data alongside physical health metrics
That said, there are real risks worth knowing. Some users fall into rumination loops, checking their mood charts obsessively and reinforcing negative self-stories. Others feel anxious when they see a string of low-mood days visualized starkly in red or gray. Confronting a hard pattern is valuable, but without tools to process it, the confrontation can feel paralyzing rather than clarifying.
It's also essential to say clearly: mood visualizations are not therapy. Reviewing your insights on self-reflection through an app is a powerful complement to professional mental health support, not a replacement for it. If your patterns reveal something significant, bring that data to a therapist. Your visual mood history can actually be a useful conversation starter in a clinical setting.
Pro Tip: Pay attention to how you feel after reviewing your mood trends, not just during. If you consistently feel worse after checking your charts, reduce the frequency to weekly reviews and pair each check-in with a positive coping action.
Pairing mood visuals with reflection for real-life change
Understanding these nuances prepares you to use mood visualizations wisely. Next, let's look at practical ways to integrate them for lasting change.
Mood visuals should be paired with coping strategies and ongoing reflection for the deepest results. The visual gives you the what. The reflection gives you the why. And the coping strategy gives you the what now. All three are necessary for real change.
Monitoring without reflection can actually trigger anxiety if negative patterns surface without any framework for processing them. Paired use, however, consistently brings measurable emotional benefits. Here's how to build that paired practice:
- Set a weekly review ritual: Pick one day a week to look at your mood trends, not daily. Daily checking can create obsessive monitoring rather than insight.
- Use targeted prompts after viewing: Try questions like "What was happening on my lowest day this week?" or "What did my highest-mood days have in common?"
- Tie visuals to action: If you notice low moods every Sunday evening, create a Sunday routine around activities that reliably lift your mood.
- Combine journal types: Pair your mood log with a gratitude entry or a shadow work prompt to add emotional context to the visual data.
- Track one habit alongside mood: Adding a single variable (sleep hours, exercise, social contact) alongside mood data often reveals powerful correlations within just a few weeks.
Exploring journaling techniques for emotional regulation alongside your visual tracking gives you a full toolkit. And if you want the research behind why these practices work, the science-backed emotional regulation frameworks explain exactly how journaling and visualization interact with your nervous system.
Pro Tip: Set a recurring calendar reminder titled "Mood review + one reflection sentence" every Sunday evening. Consistency matters more than depth when you're building the habit.
A fresh perspective: Why mood visualizations aren't enough on their own
To close, here's a perspective that goes beyond common advice.
There's a quiet assumption embedded in most mood-tracking culture: that seeing your emotions clearly equals understanding them. It doesn't, not automatically. Visualizations make your emotional data visible, but data without context is just noise with good design.
The most profound shifts we've seen come when people treat their mood charts as conversation starters with themselves, not as conclusions. A red-heavy week doesn't tell you why you struggled. It just confirms that you did. The real work begins when you sit with that visual and ask hard, specific questions.
Visual tools amplify but shouldn't replace reflective journaling and coping practices. Most people miss this because tracking feels productive. It satisfies the urge to do something about your mental health without requiring the harder work of sitting with discomfort and writing through it. Tracking is the map. Reflection is the journey. You need both.
Using your mood visuals as a springboard for self-exploration for clarity is where the real emotional growth happens. Think of each chart review as an invitation to go deeper, not a destination in itself.
Explore mood visualizations with Voisley
Ready to try visual mood tracking for yourself?
Voisley brings together everything you've read here into one guided space. The Voisley mood visualization platform combines AI-powered mood tracking with structured reflection prompts, so you're never just staring at a chart alone. You get the visual pattern and the guided questions to make sense of it.

Whether you're new to journaling or looking to deepen an existing practice, Voisley's AI-driven journaling strategies help you move from emotional data to genuine self-understanding. The platform supports gratitude journaling, shadow work, goal tracking, and mood analysis all in one private, science-backed environment. Start with one mood log and see what your patterns reveal.
Frequently asked questions
Can mood visualizations replace traditional therapy?
No, mood visualizations are supportive tools that work best alongside professional care. They shouldn't replace therapy but can complement it by giving you clear data to bring into sessions.
Are there any risks with mood visualizations?
Some users experience temporary distress when confronting low mood trends, so monitor your reactions and take a break from daily tracking if it's causing more anxiety than insight.
How do mood visualizations actually work in apps?
Apps like Daylio let you log your mood and activities daily, then generate visual trends, heat maps, and avatars to help you identify emotional patterns over time.
Who benefits most from mood visualizations?
Teens and neurodivergent users often gain the most, along with visual learners and those who find verbal expression of emotion difficult or limiting.